Visualization
Overview
Visualization offers the element of having useful insights not only for the runtime, but also of the application. It provides standard and custom dashboards which can be helpful for visualising the state of the runtime or any general/specific trends in your business.
Elements
The IgniteConnex Observe Platform has these three integral components which bring together visualization.
Data sources : The source of the data that needs to be fed to the dashboards.
Dashboards : The canvas where user can create multiple panels based on the added datasource.
Users : The users who can act as viewers or collaborators on these dashboards.
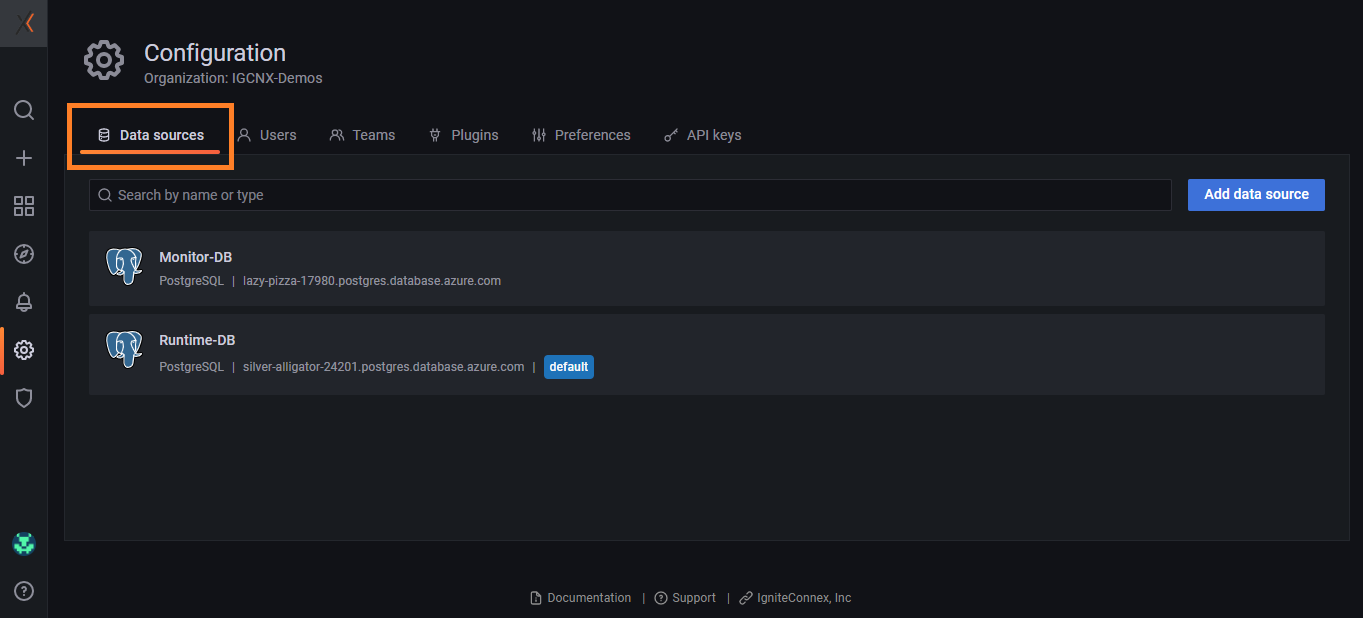
Data sources
Users can add single or multiple datasources inside their organization. These datasources will be the sources from where data will be fed to the panels in the dashboard.
To add a new data source to your org,
Click on 'Data sources' from 'Configuration'.
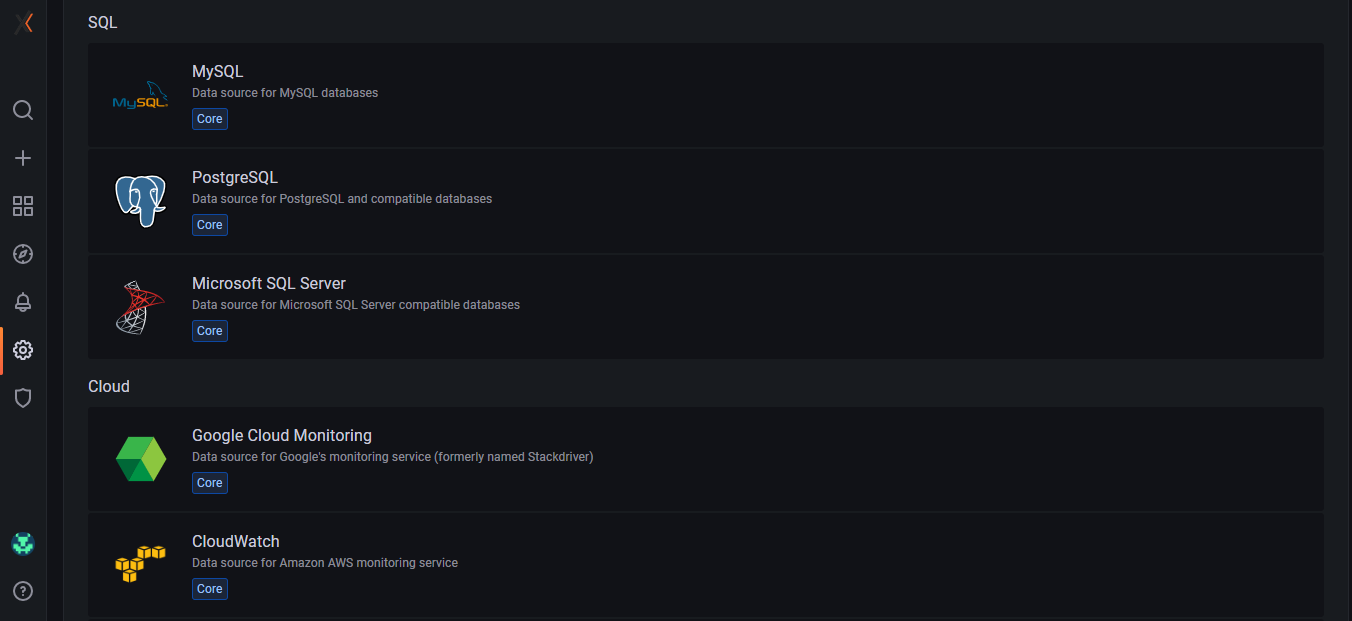
From the 'Add data source' button, enter the next page to set up a new data source.
Select a suitable datasource from the list.
Add the required database credentials.
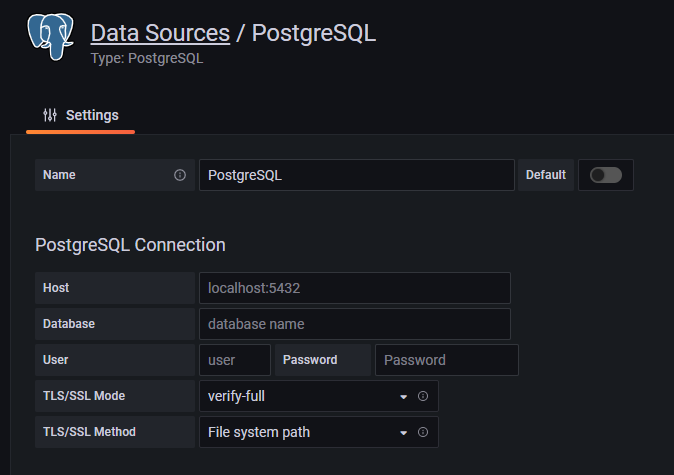
Add auth and configure the data source as required.

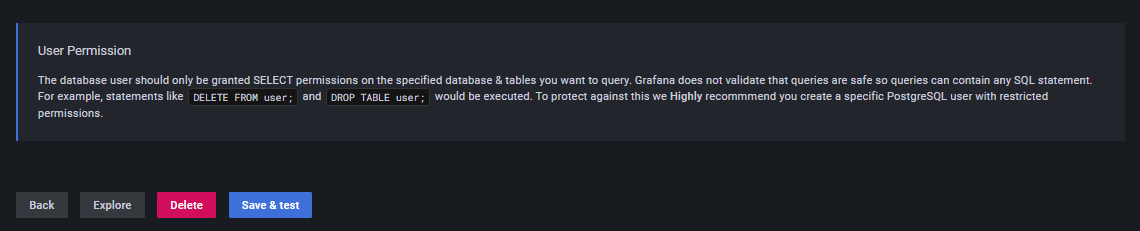
Save and Test your connection.
Dashboards
Dashboards are a collection of different panels presenting different insights about your system and application. These dashboards need to be connected with a data source. Each panel can be connected with one datasource and multiple queries can be run based on the requirement.
To create a dashboard from Postgres DB in the following case:
Navigate to the browse tab from the dashboard dropdown in the sidebar.
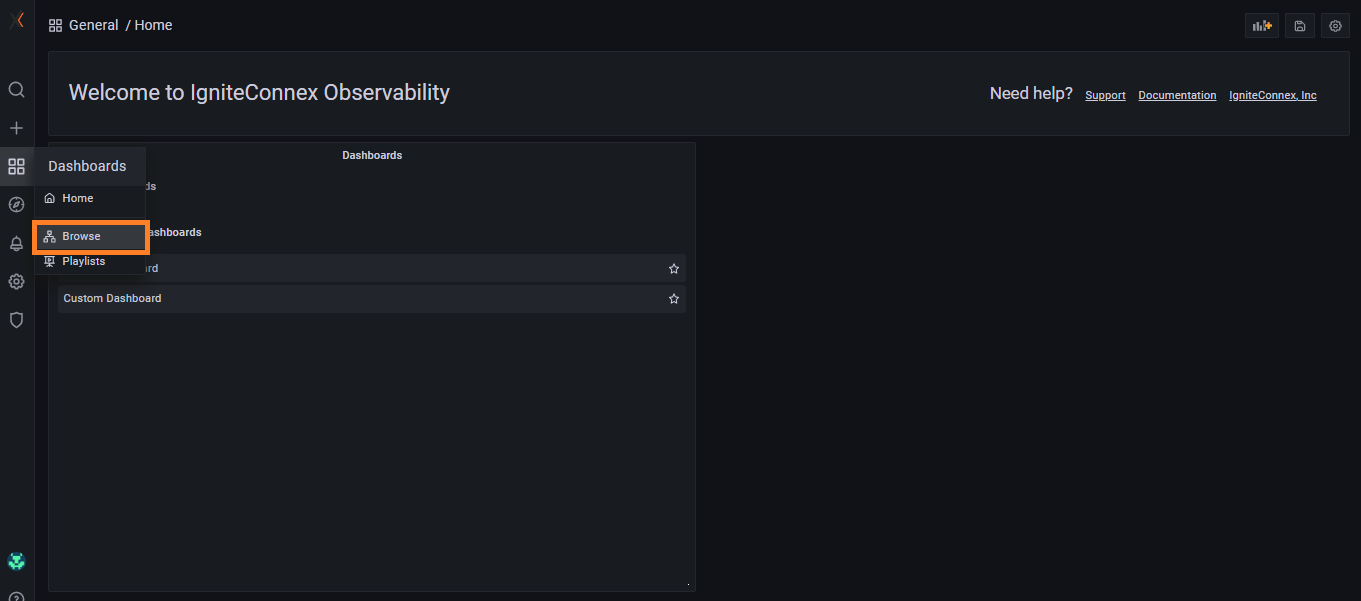
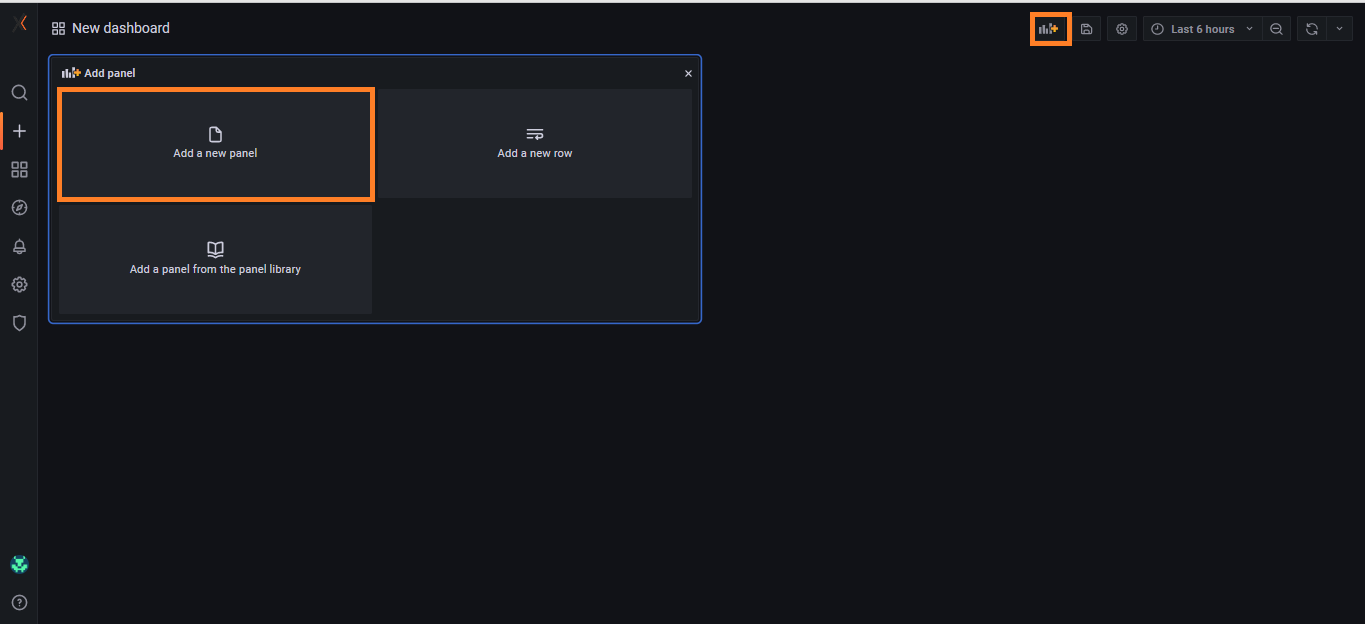
Create a new dashboard and add a new panel to it.
Select the suitable datasource for the panel and modify the query in the query inspector. Note that the time column is a required field.

Additionally you can utilize the Edit Query option and write a query on your own. Multiple queries can also be used based on the requirements.

From the side panel, choose any visualization that suits your use case.
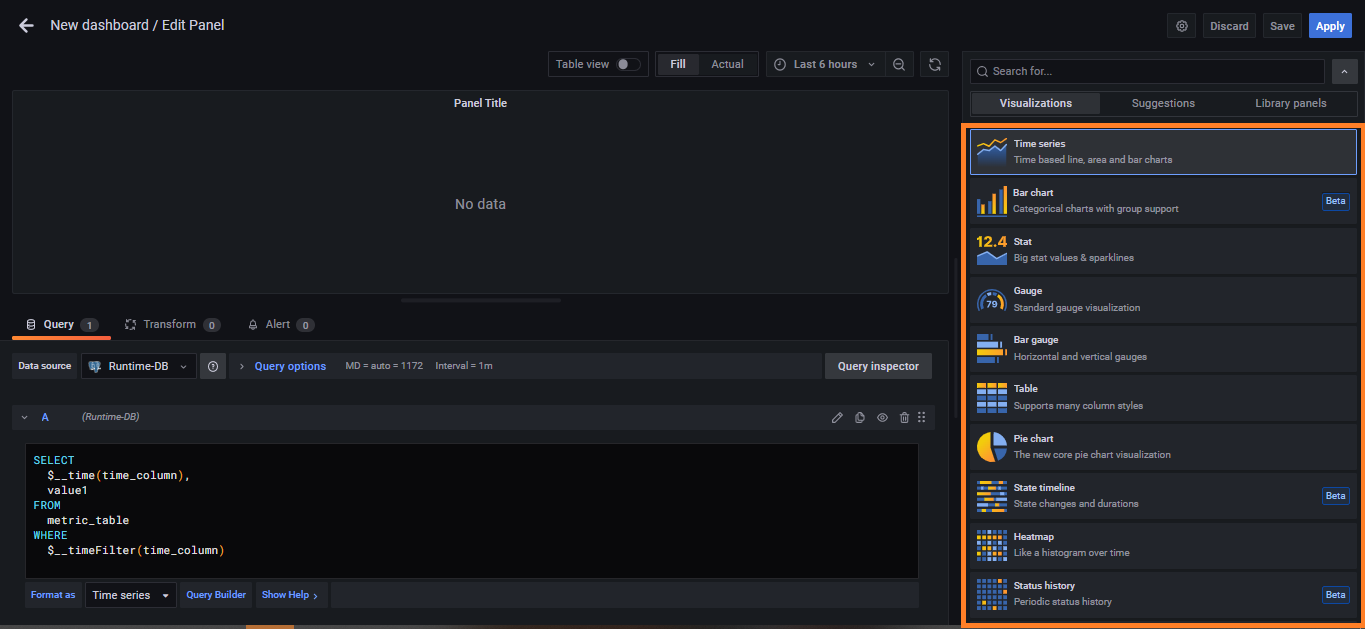
The additional enhancements to the panels and graphs can be done using the modification options provided in the side panel.
Save the panel.
Users
The dashboards and datasources can be contributed or viewed by the users added to the org in question, based on their roles.
Users can be given 'Admin', 'Editor' or 'Viewer' roles in your org.
Example Dashboard Panels
Memory Usage

CPU Usage

HTTP Endpoints

Conclusion
Finally, now you have knowledge of all what visualisation offers. So what's the wait for? Start leveraging the features of visualisation and have better insights of your system.