Monitoring System
Overview
With IgniteConnex Monitoring , you can easily keep an eye on the health and performance of your applications. It allows you to check that your apps are working well and catch any issues quickly, helping you maintain a smooth experience.
Enable Monitoring System
IgniteConnex Monitoring offers a comprehensive solution that not only provides insights into system performance but also facilitates exception handling and notification emails, all in one convenient platform.
Configuration
To set up monitoring for your applications, follow these steps:
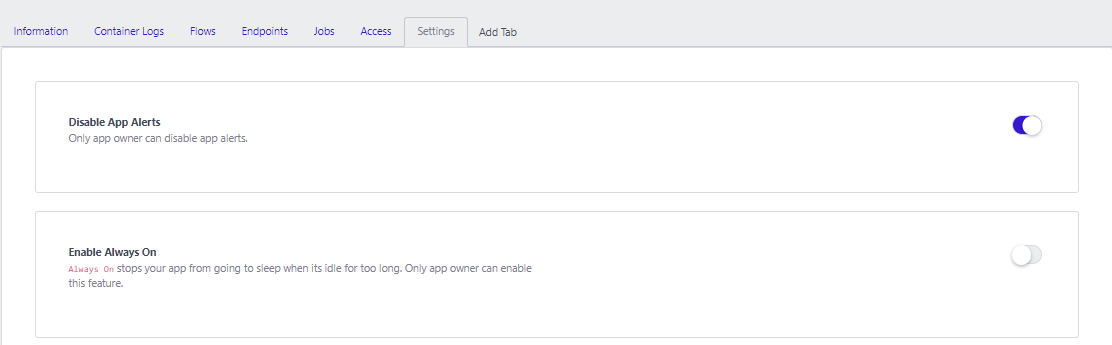
Step 1: Enable App Alert toggle
Start by enabling App Alerts in your digital product's settings. Locate the dedicated toggle button for this purpose and turn it on. This action sets up health notification emails to be sent if any issues arise with your app's performance during runtime. This ensures you can swiftly identify and address problems, maintaining the smooth operation of your digital products hosted on IgniteConnex. This foundational step is crucial for effective monitoring and proactive management.
Step 2: Add Environment Variables
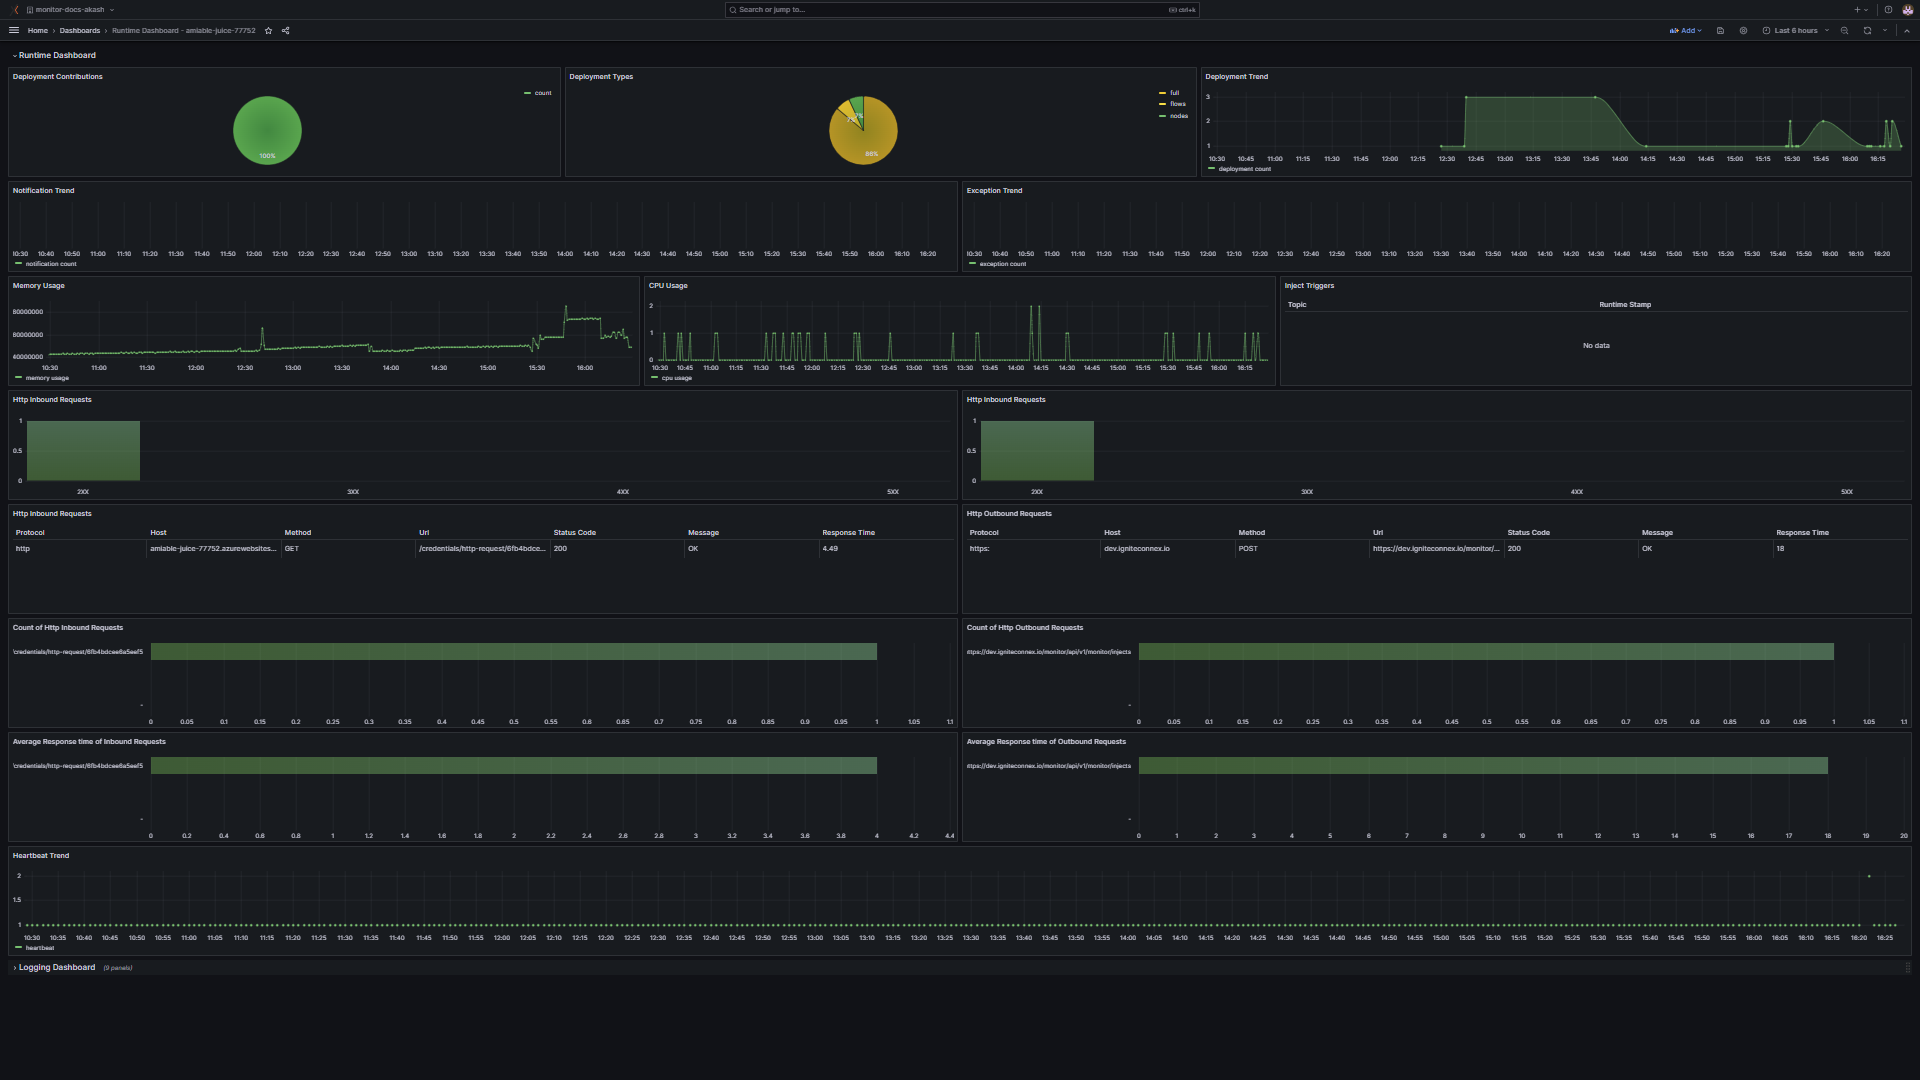
To access the valuable Runtime dashboard and Logging dashboard for monitoring, you'll need to complete a straightforward configuration step by adding the necessary environment variable(IGNITE_MONITOR_ENABLED). Once configured, you can effortlessly monitor your app's status using the informative graphs available on the dashboard. These graphical representations provide a clear snapshot of your app's performance, making it easy to stay well-informed about its status and ensure its optimal operation.
Environment Variable you need to add is:
IGNITE_MONITOR_ENABLED = TRUE
After configuring the App Alerts, our monitoring system will keep a close watch on your app's health and performance 24/7. You can easily monitor your app's status using the graphs on the dashboard. These graphs visually represent your app's performance, making it simple to stay informed about how it's doing.
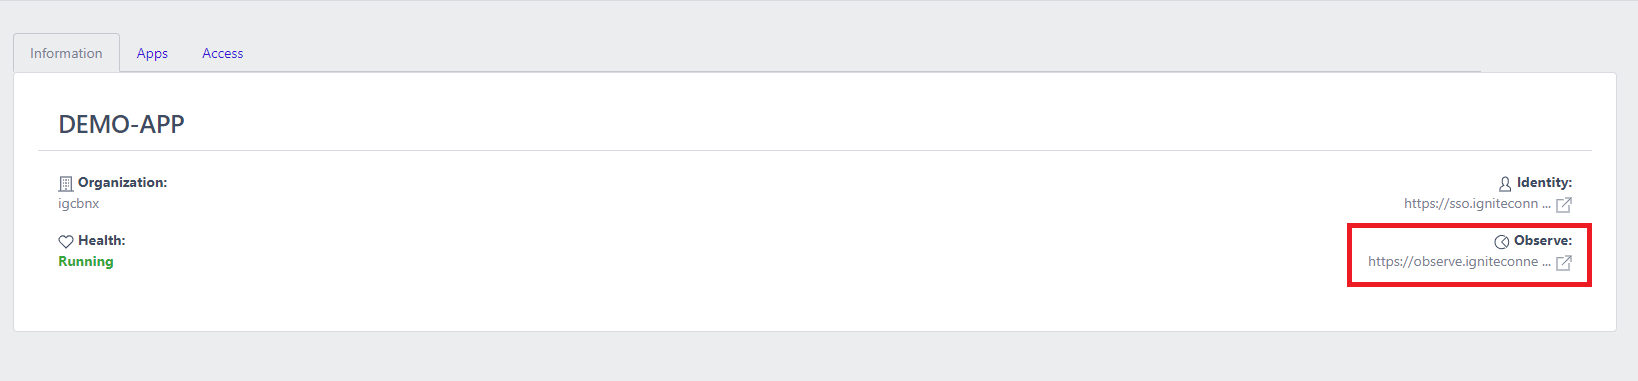
Once you click here, will redirect you to IgniteConnex Observe as shown below:
How does IgniteConnex monitor work?
The "Monitoring Connector" is a powerful tool designed to enhance your monitoring experience within IgniteConnex. This feature provides an efficient and streamlined method for monitoring the health and performance of your IgniteConnex runtime. With the Monitoring Connector, you can access a range of valuable functionalities:
Email Notifications: Configure email notifications at your preferred frequency, whether it's frequent updates, daily summaries, or weekly reports. This ensures that you stay informed about your IgniteConnex runtime's health without constant manual checks.
Runtime Health Tracking: Monitor the health of your IgniteConnex runtime in real-time. The Monitoring Connector offers insights and alerts to keep your runtime in top shape.
Exception and Notification Emails: Receive notifications and exception emails related to the performance and status of your IgniteConnex runtime. This feature helps you promptly address any issues that may arise.
In the following sections, we will walk you through the process of adding and configuring the Monitoring Connector for your IgniteConnex runtime. By leveraging this tool, you can efficiently manage and optimize your IgniteConnex environment.
IgniteConnex monitor offers
Users can choose any or all notification types mentioned below.
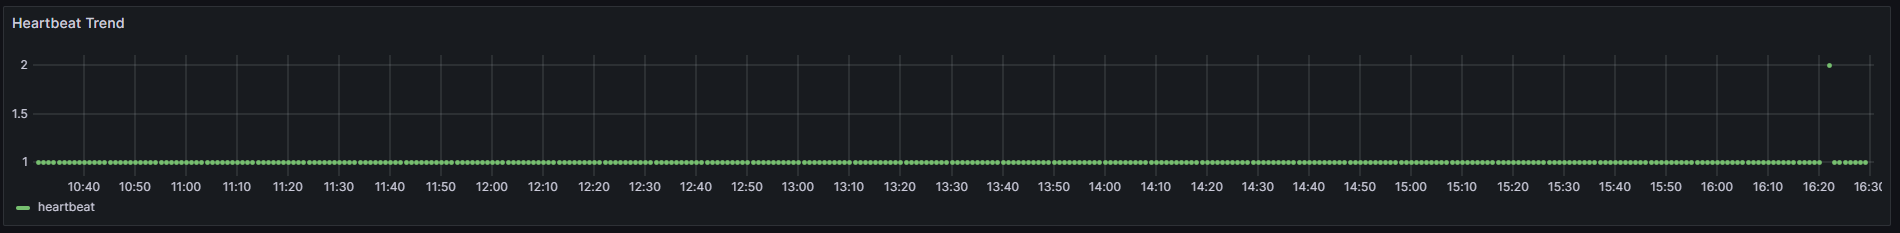
Heartbeats: Heartbeats are like a built-in health check for your system in IgniteConnex. They automatically let you know if your system goes down and when it's back up. No need to configure anything; it's all there by default. On the IgniteConnex Observe dashboard, a straight line means your system is healthy and running normally. If there's a bump or dip in the line, it's a sign that something might be off with your system. It's an easy way to stay on top of your system's health.
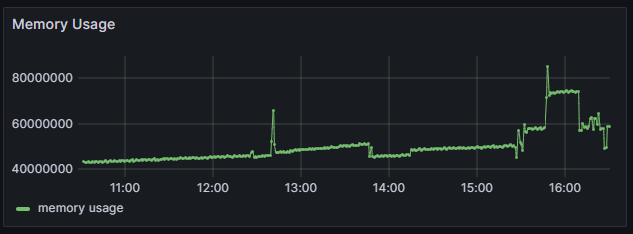
Memory Usage: Presented as a timeseries graph on IgniteConnex's dashboard, acts as a watchful guardian over your system's memory. There's no need for configuration; it's readily available. When your system's memory is operating smoothly, the graph maintains a consistent pattern. However, any noticeable fluctuations in the graph signal potential memory-related issues. This graph provides a dynamic visual representation to help you ensure optimal memory performance for seamless system operation.
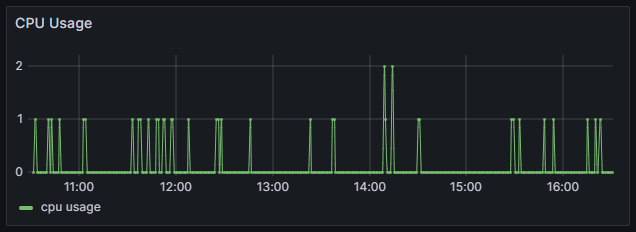
CPU Usage: Closely tracks how much work your system's CPU is doing over time, especially within your runtime setup. You don't need to set it up; it's always active. The CPU usage graph shows when your computer's CPU is working hard or not, depending on what you're doing in your runtime. This helps you see how efficiently your computer is running for your specific needs. It's like a performance gauge for your computer.
Example Emails
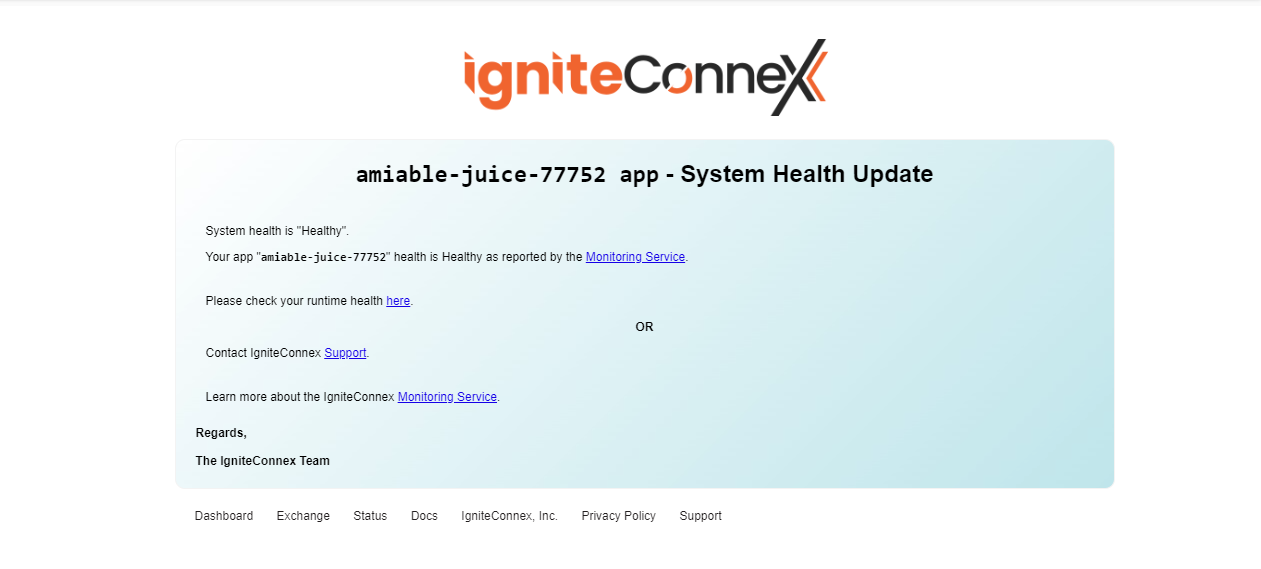
System Up Health
The below is an example email notifying the user about the runtime being up and running after experiencing a downtime.
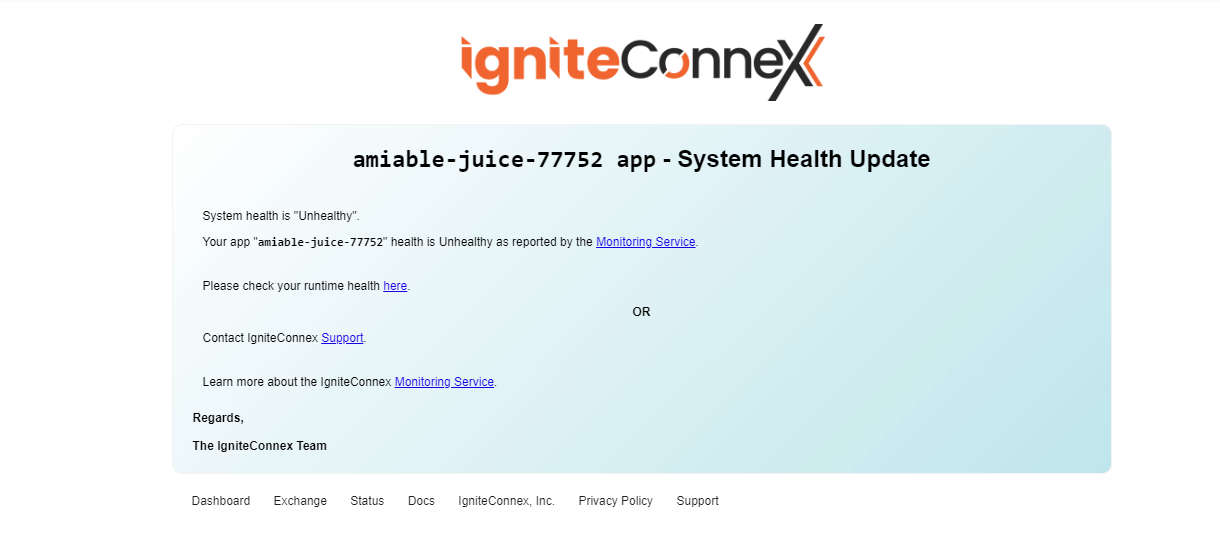
System Down Health
The below is an example email notifying the user when the runtime experiences a downtime.
Conclusion
Monitor is an all-in-one solution for system notifications. Once the Monitor is set up, you can sit back and relax! Monitor will let you know in case of anything unusual!