
Introduction
Hello World! Have you too been struggling to monitor your system performance or managing your business insights? Well, we got you covered.
IgniteConnex Observability provisions the capability of monitoring the system continuously. While the standard dashboard gives insights about the system metrices, CPU performance etc, you can create custom dashboards and visualise your business data in a number of possible ways.
In this blog I will take you through the process of creating and sharing custom dashboards.
Let's dive in and create a Dashboard from scratch inside of your org.
Adding a Datasource
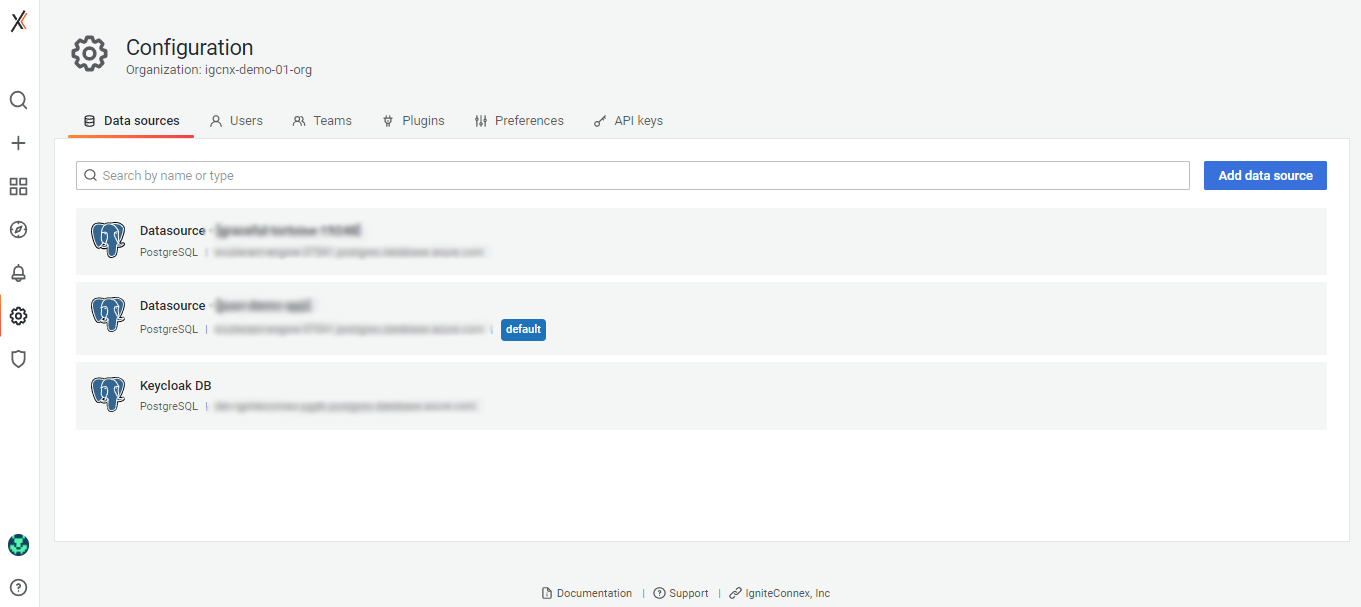
To create a dashboard inside of your observability org, you will first need to add a datasource for the custom dashboard. For doing so, click on the gear icon from the sidebar and select the datasource tab.
Click on Add data source.
You will be prompted to choose a data source type. There are a number of types that you can choose from.
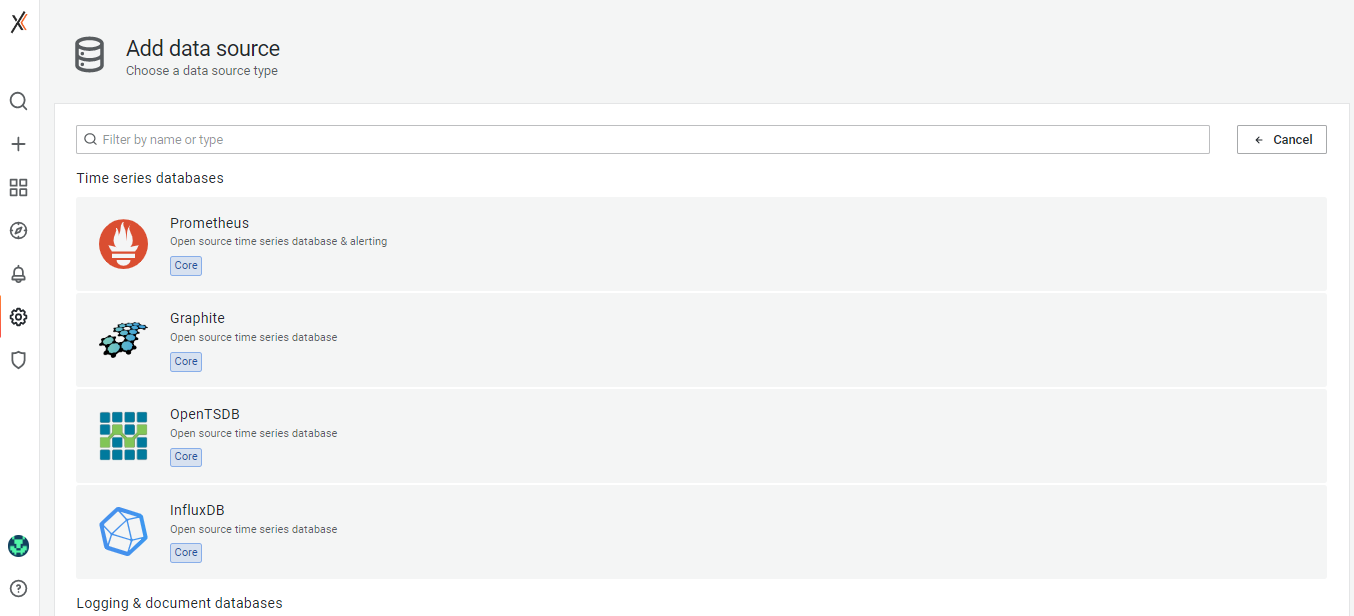
Choose a datasource type and continue. (I selected postgreSQL). The next screen lets you add your database details.
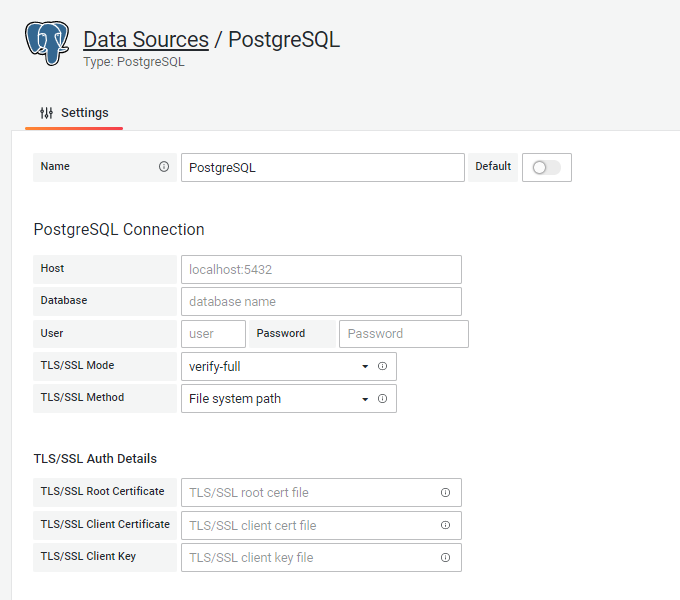
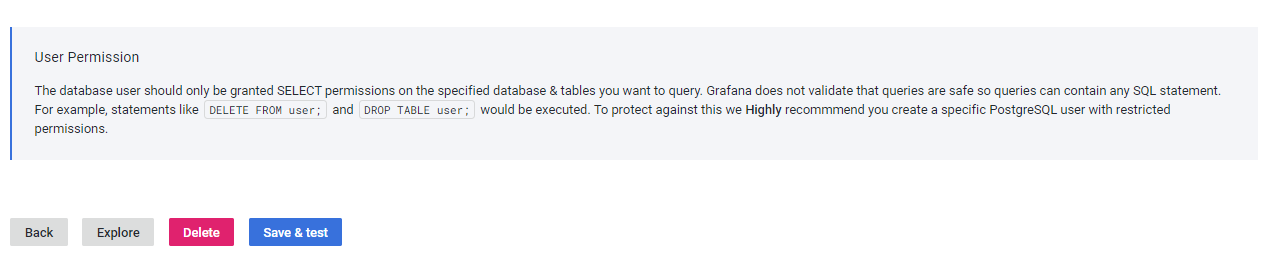
Once done, click on Save & test
Your datasource should get validated. The newly added datasource should be visible in the datasource tab.
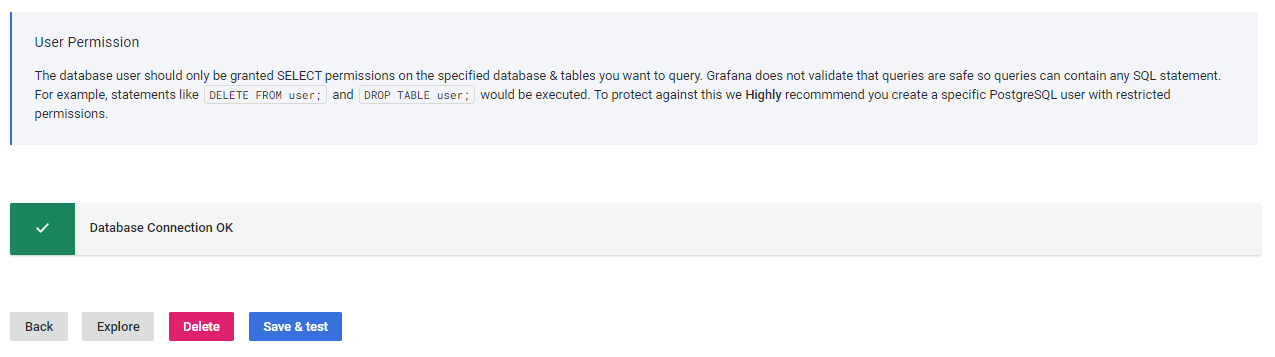
Make sure to give appropriate database credentials while adding the datasource. This data will be used for creating the dashboard panels.
Creating Dashboards
Going forward you will need to click on the dashboard icon from the sidebar and select browse.
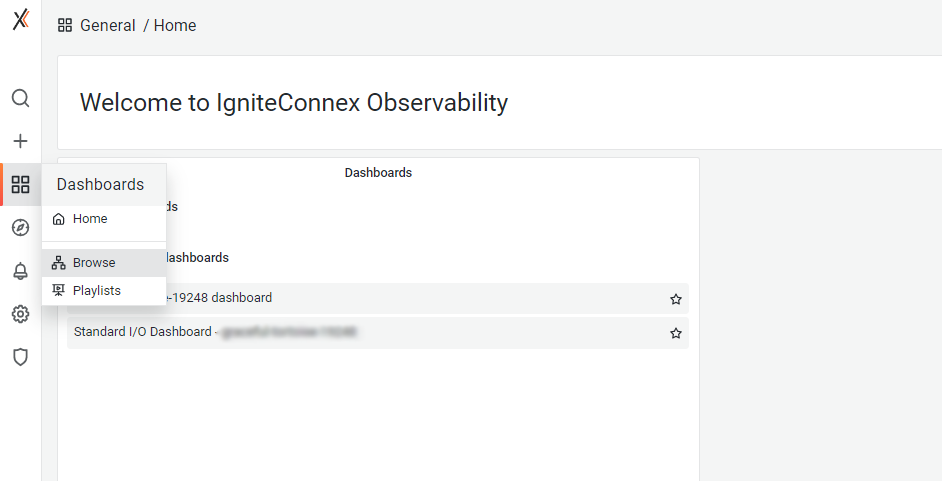
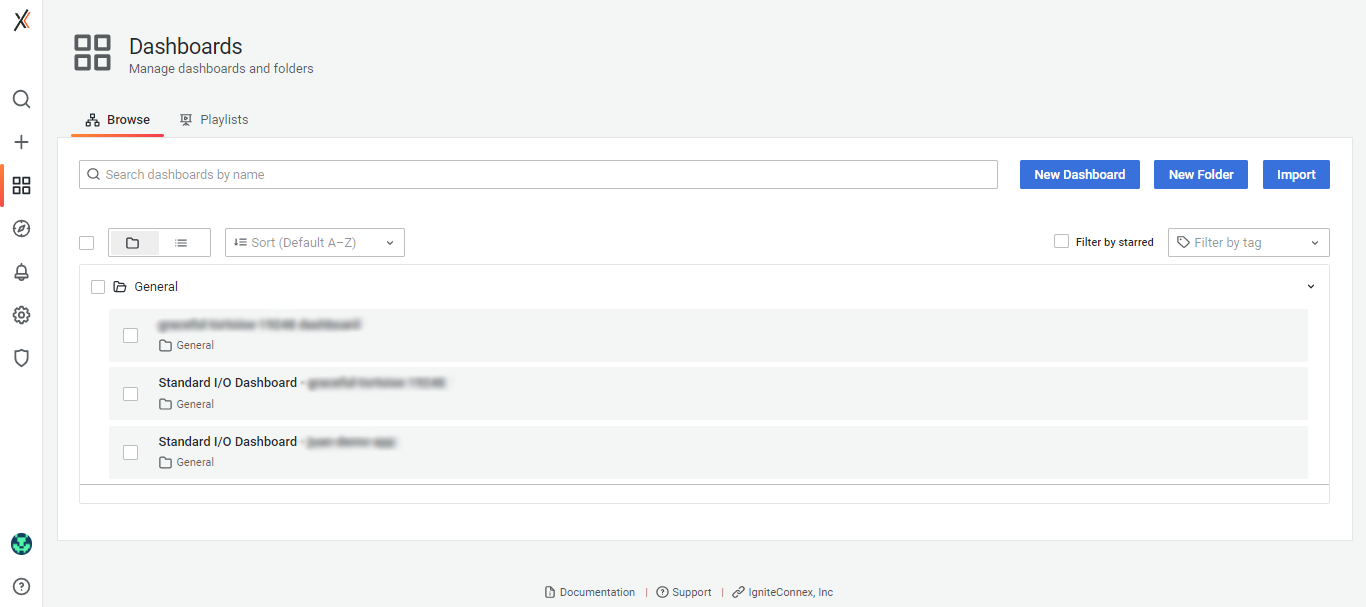
You will be redirected to the dashboard screen. Here you find a list of all your dashboards.
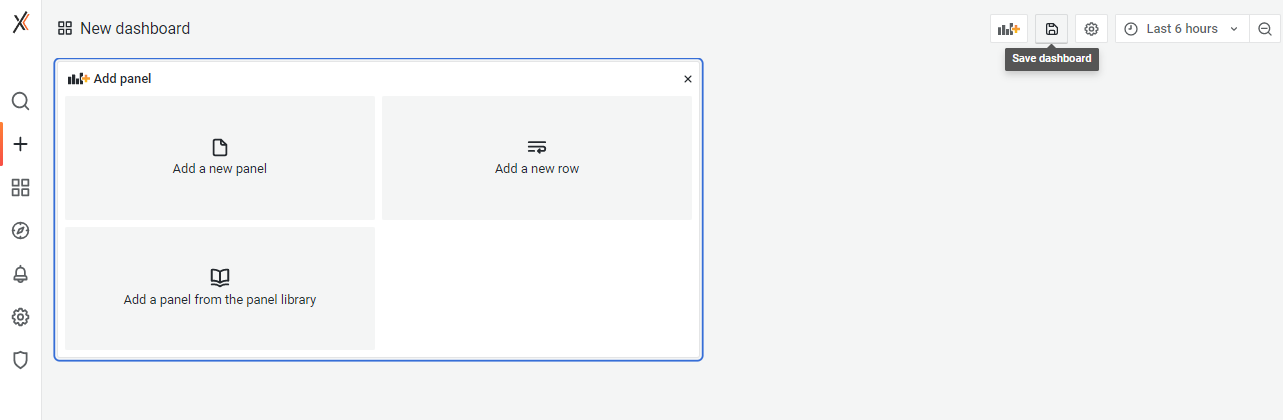
Click on New dashboard.
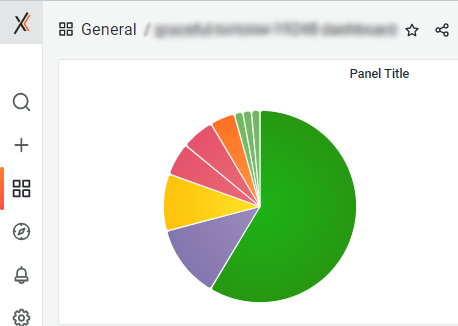
A new dashboard gets created. You can save the dashboard from the save option. A dashboard is a collection of different panels and hence, now we will move on and create some panels.
Next we will need to attach a datasource to the panel. Click on the datasource dropdown and select the datasource we just configured. The datasource is now successfully added.
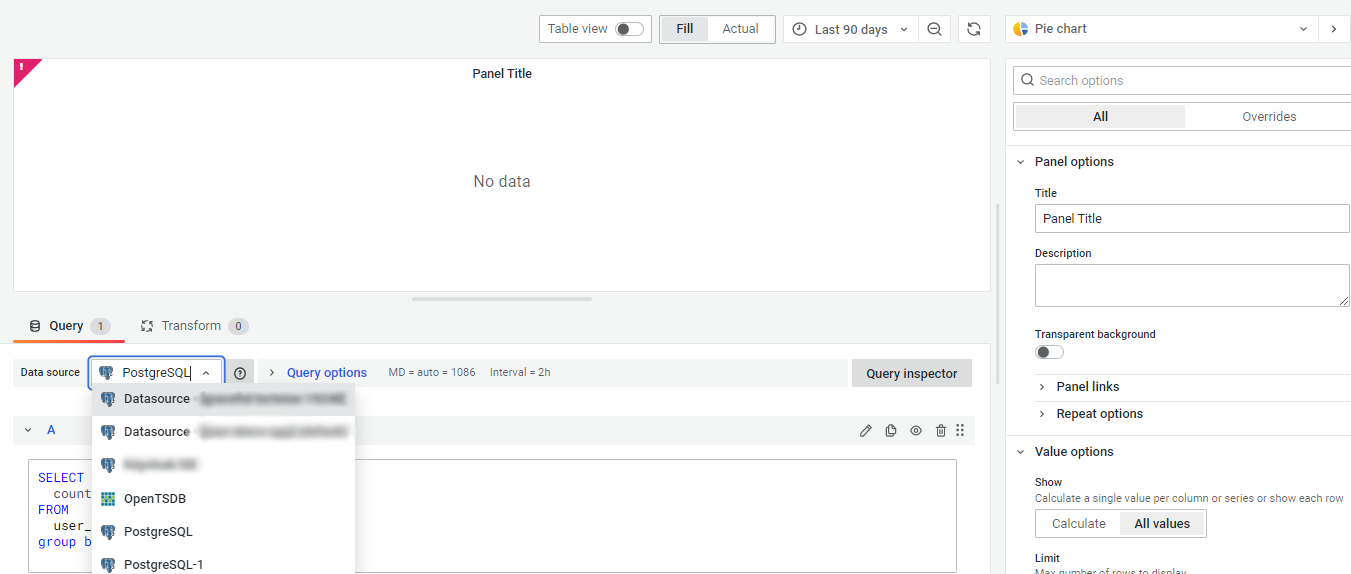
Now you can go ahead and write any query to fetch data from the datasource. You can either use the query builder to fetch the data or can write your custom query by clicking on the Edit SQL option below the query builder.
You can either format the output as a timeseries or as a table.
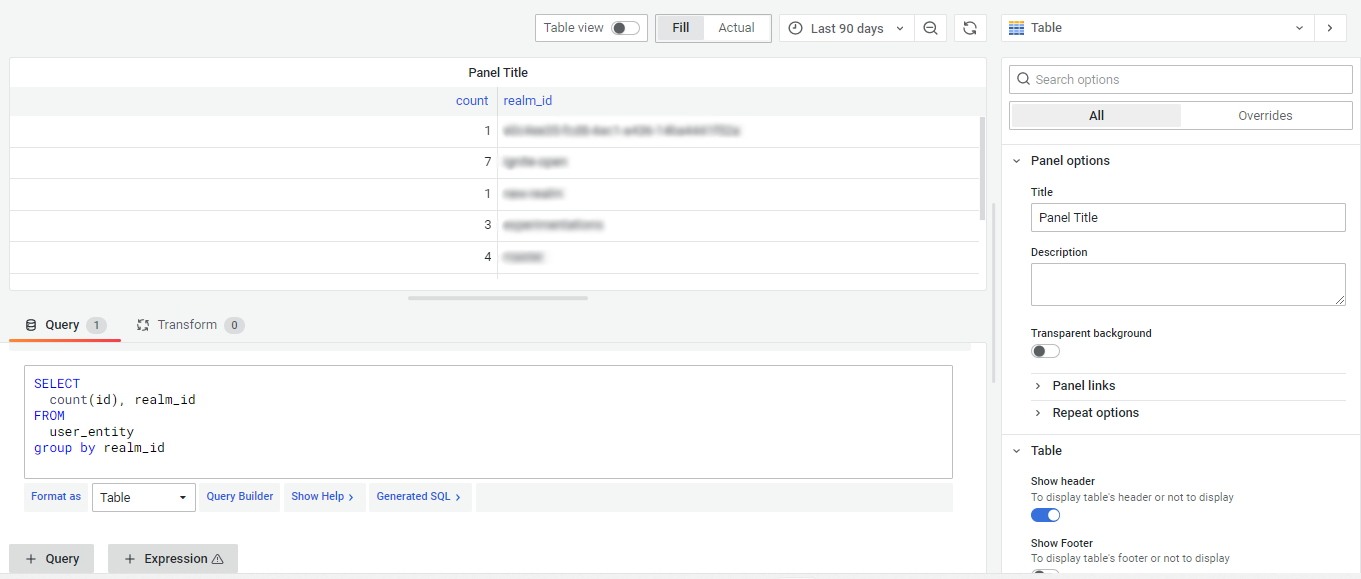
Since the data is now visible on the panel as a table, we can choose any of the visualisation options from the side panel.
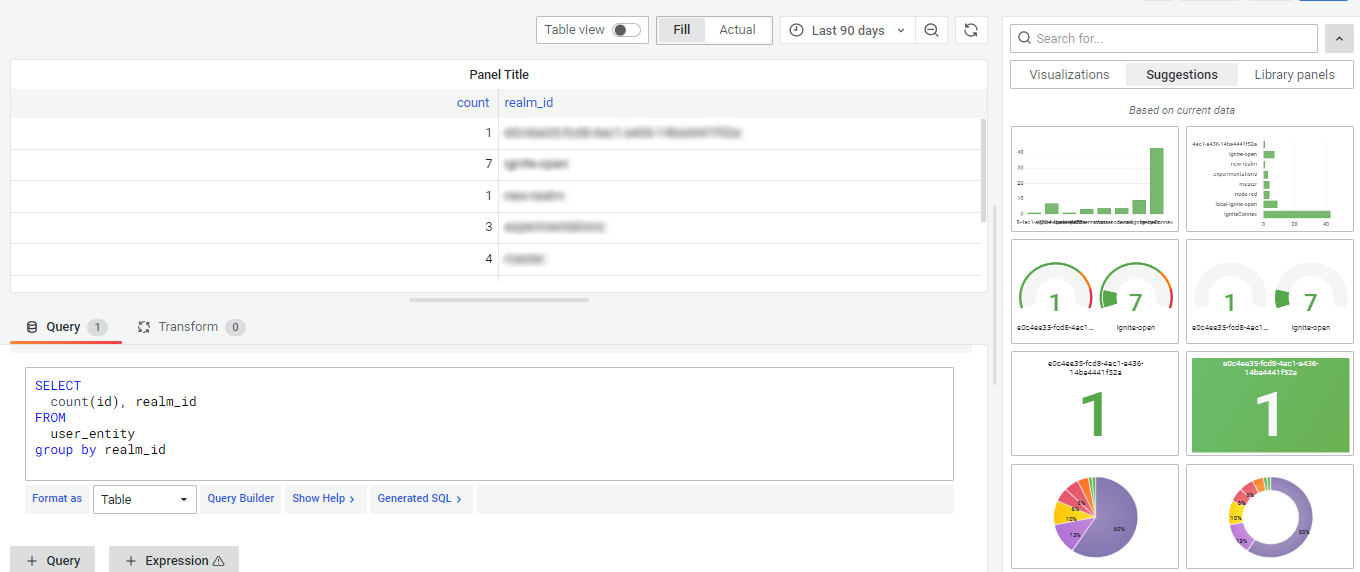
Furthermore you can change the look of the visualisation using the options available in the side panel.
Apply the changes and the new panel will be visible on the dashboard. Don't forget to save the dashboard.
Congratulations! You have created your first dashboard!
Sharing the Dashboard
Next, if you want to share your amazing dashboard, you can do so in different ways.
Adding a New User to the Org
Any new user added to the org has access to the dashboard created inside the orgs. You can add users in your org and this will give them the capability to make contributions to the dashboard.
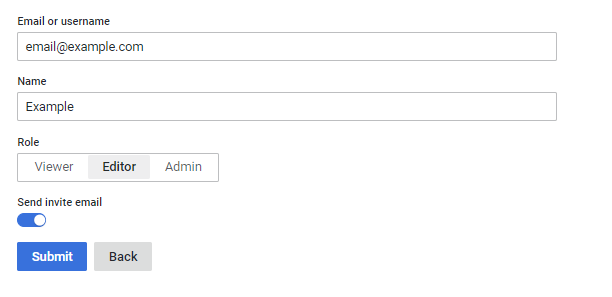
To add a new user,
Click on the gear icon on the side bar and navigate to the users tab.
Click on Invite.
This screen lets you invite new users to your org. While adding the users, you can also select the role you want to give to the new user.
Sharing the Dashboard externally.
To share the dashboard with the users of other orgs, click on the share icon against the dashboard name.
Navigate to the Export tab and click on View Json.
This Json can be shared with other users, which can then be imported using the import option on the dashboard screen.
Now that you have successfully created and shared a dashboard, you are ready to roll. Stay tuned!