Monitoring
Overview
Ignite Monitoring is the process of observing and tracking the performance, behavior, or state of a system. This includes monitoring memory usage, cache utilisation, thread and page activity, and job throughput. It is the process of collecting and analyzing metrics and logs from Ignite.These metrics and logs help you understand the performance of your Ignite system and any related issues. With Ignite Monitoring, you can monitor the memory and cache utilisation of your system to respond accordingly.
How to configure Application
To create an Ignite Monitor, you need to follow the steps below:
1. Login your credentials
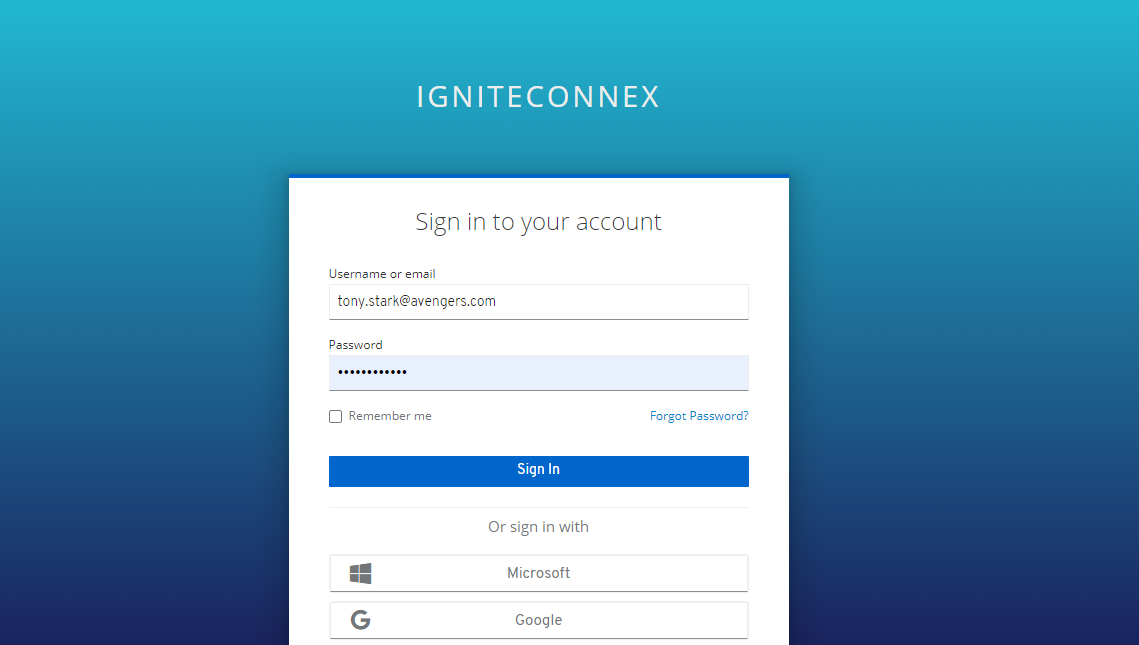
Open the Ignite Dashboard and log in with your credentials. First, navigate to the Ignite Dashboard. Then enter your credentials to log in to the Dashboard. Once you are logged in, you can start monitoring and access advanced features.
- There are many signing options, we can use any of them as per our needs.
2. Create a new digital product
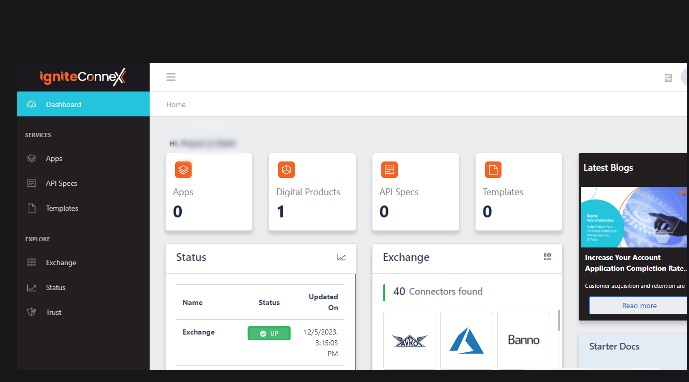
After successful login, you will see your Dashboard.
Click on Digital Products.
To create a new digital product, first gather your team's requirements and determine the name of the product.
The screen will look like this.
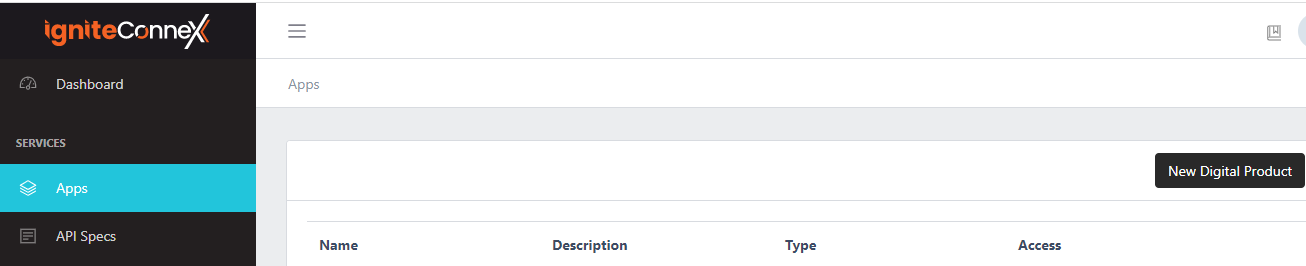
Now we need to click on the New Digital Product option. The screen looks like this when you click on the New Digital Product option.
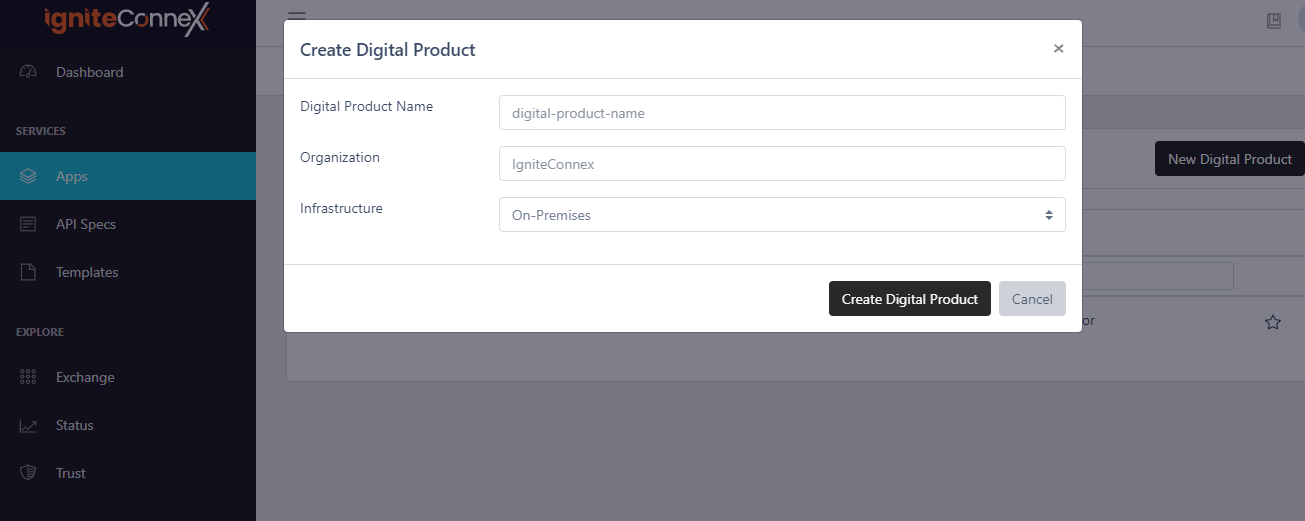
Now give these attributes.
- Name Digital Product.
- Specify a valid organisation name.
- Select On-Premise or Cloud as required.
3. Register the app.
Now click on Apps and then on New to start creating your app.
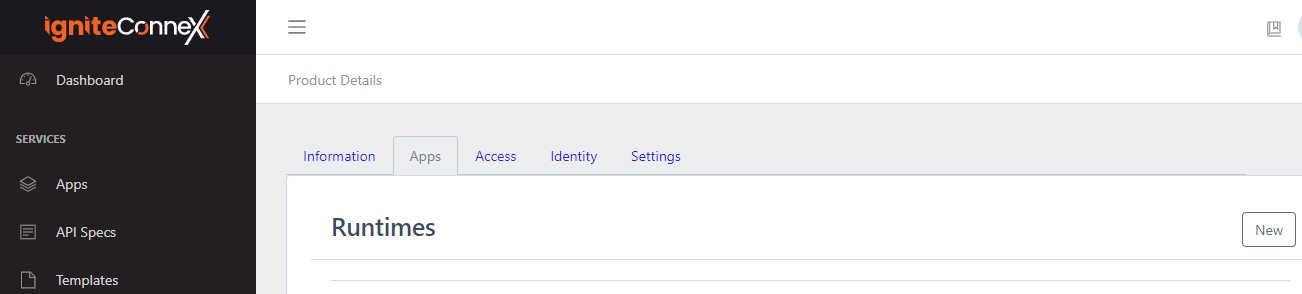
When you click on New, the screen looks like this.
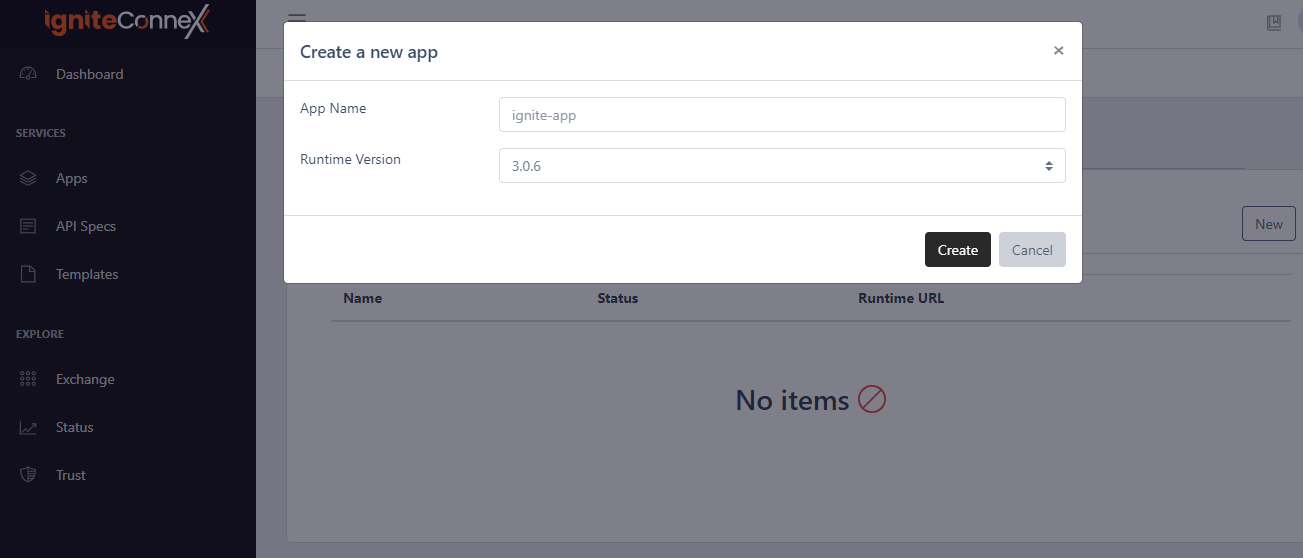
- Give your app a valid App Name and a Runtime Version.
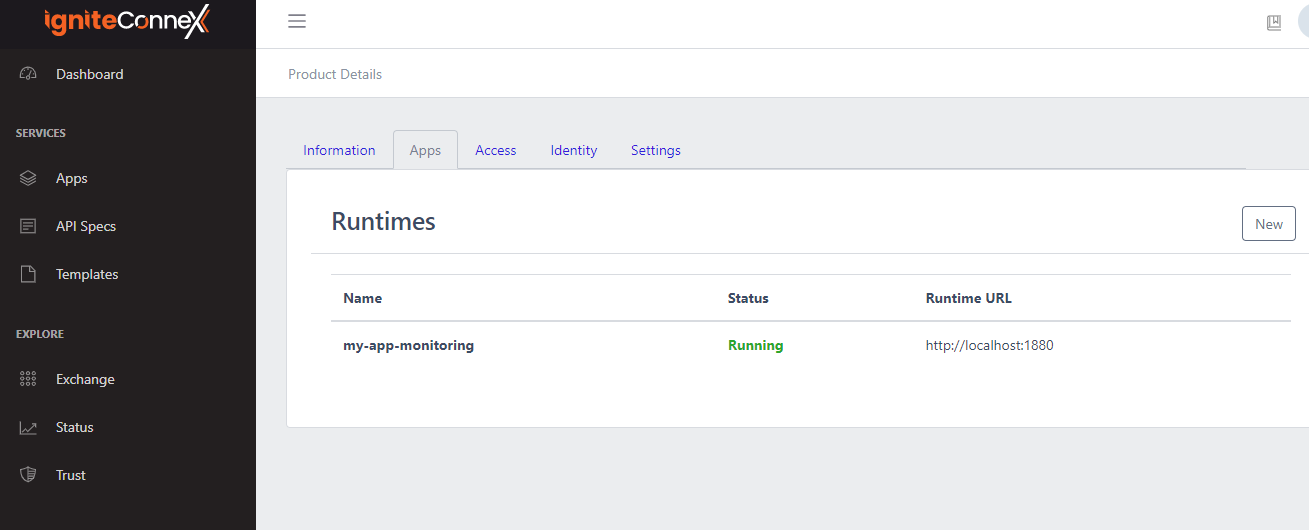
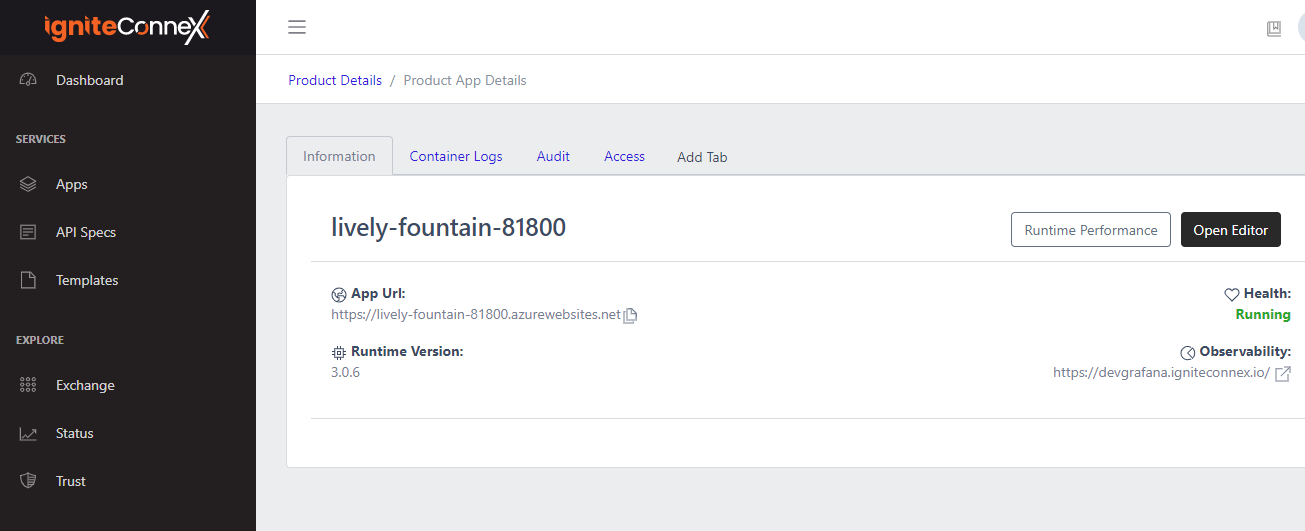
After successful app creation, our screen looks like this. It shows the app in the status Running.
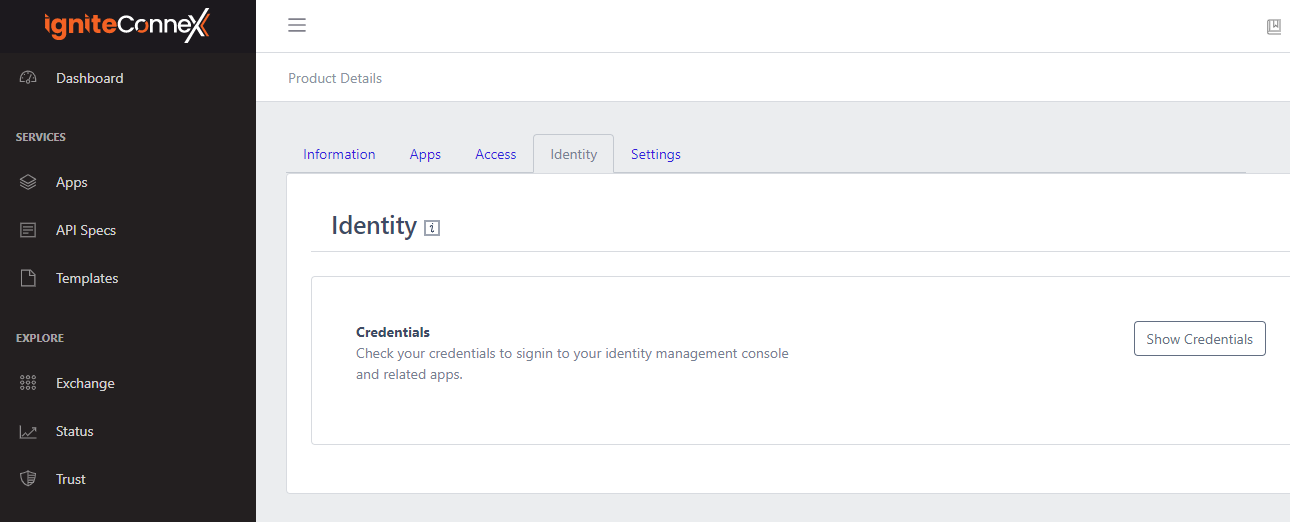
- We can see our credentials, it is displayed under the attribute Identity.
When you click on your running app, the screen looks like this.
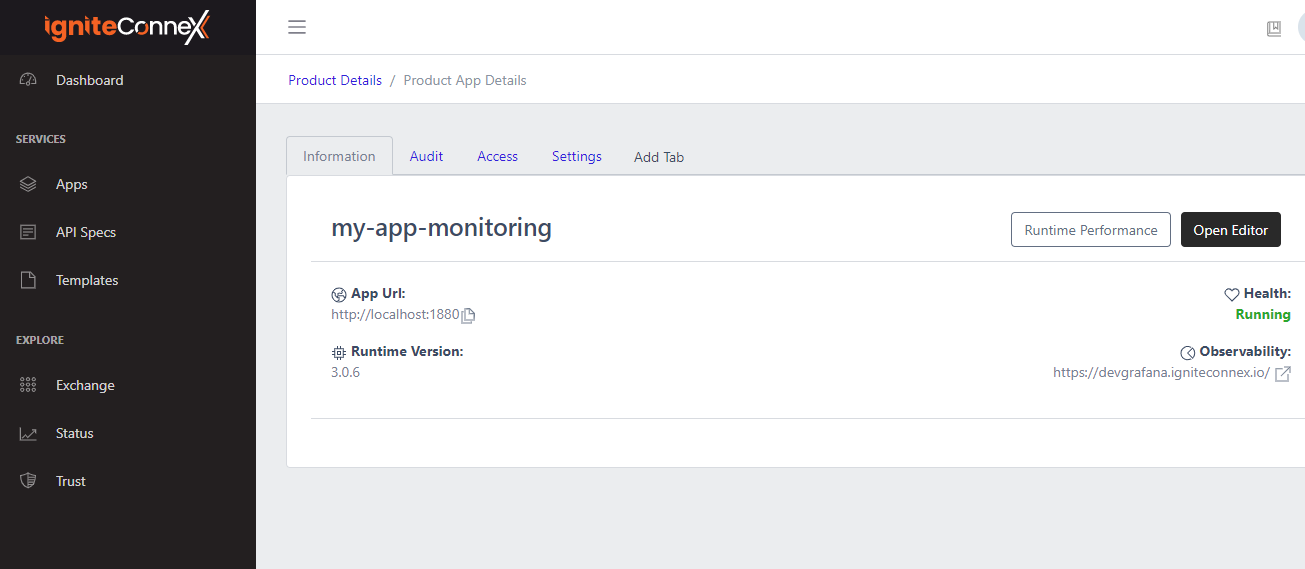
Here we have different tabs and each of them plays a crucial role.
Now click on the Settings tab to activate the app alerts (only the owner of the app has the authorisation to activate or deactivate them).
- The screen looks like this.
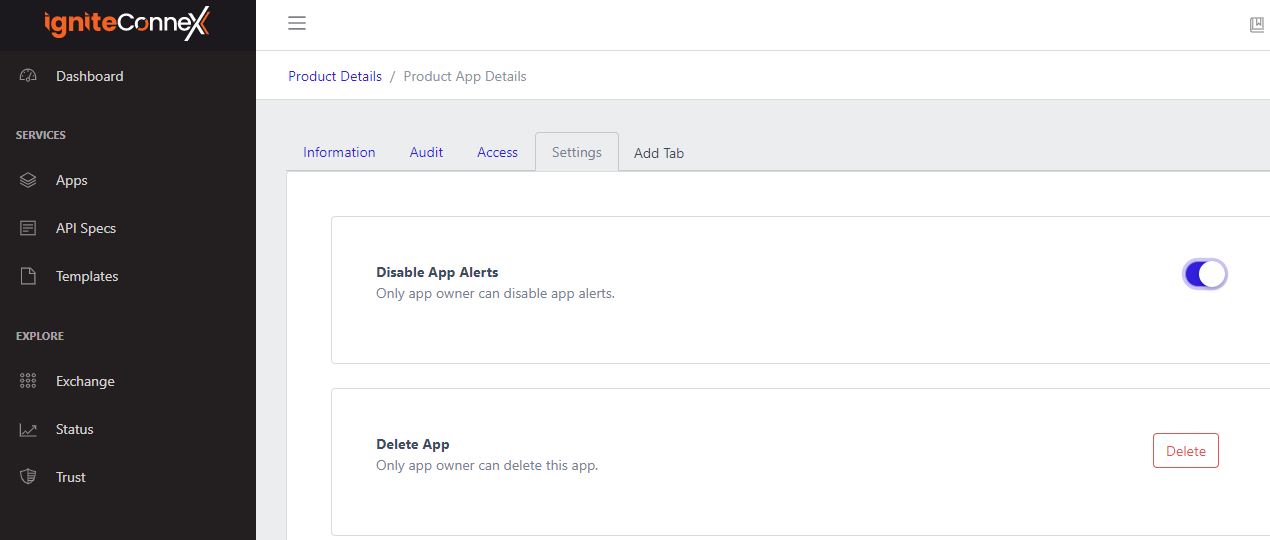
- The owner of the app only has the ability to access different tabs that have different properties. Like Container Logs, Audit, Access and many more.
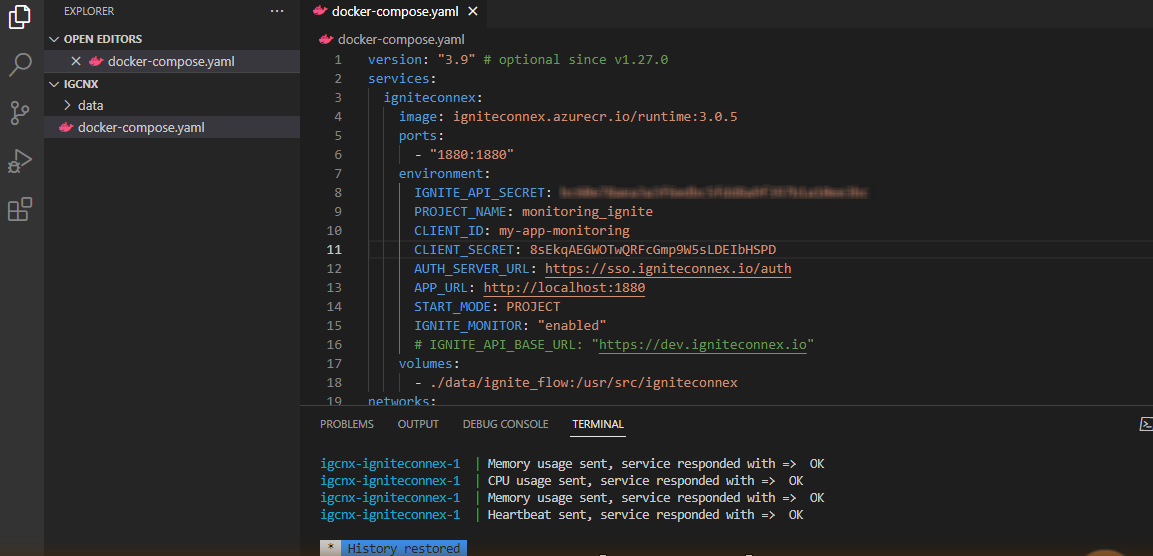
4. Add the following environment variables to the docker-compose.yaml file.
- IGNITE_MONITOR: "enabled"
5. Flow
- Once we have a clear understanding of the user's needs, we can create a visual representation. To create an effective flow for a digital product, you should first define the process and ensure that each step is intuitive and logical. Ultimately, the flow will look like this.
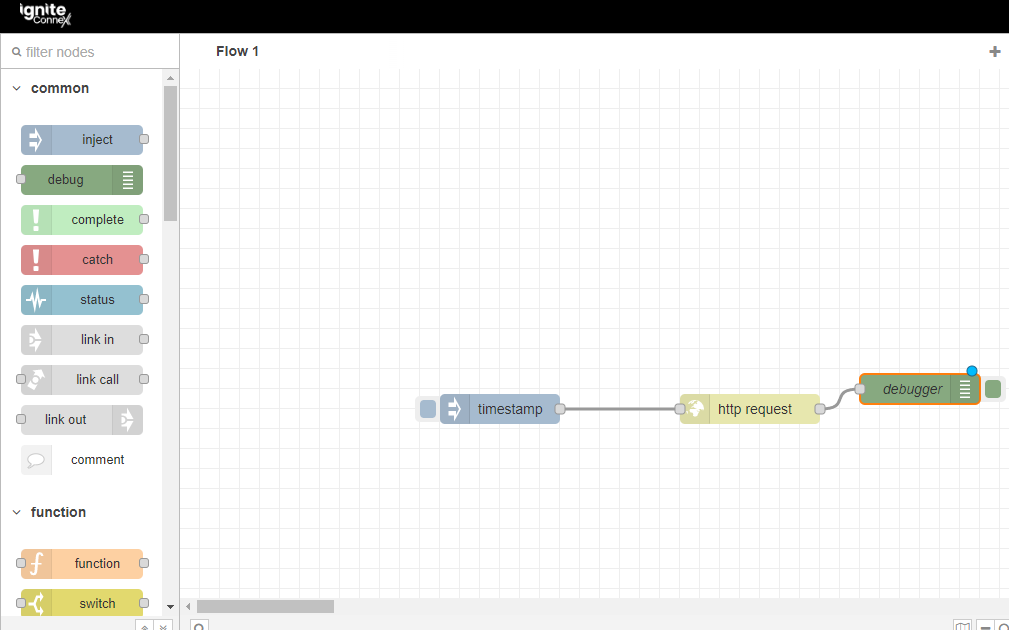
- It uses three nodes;-
- Timestamp
- HTTP Request
- Debugger
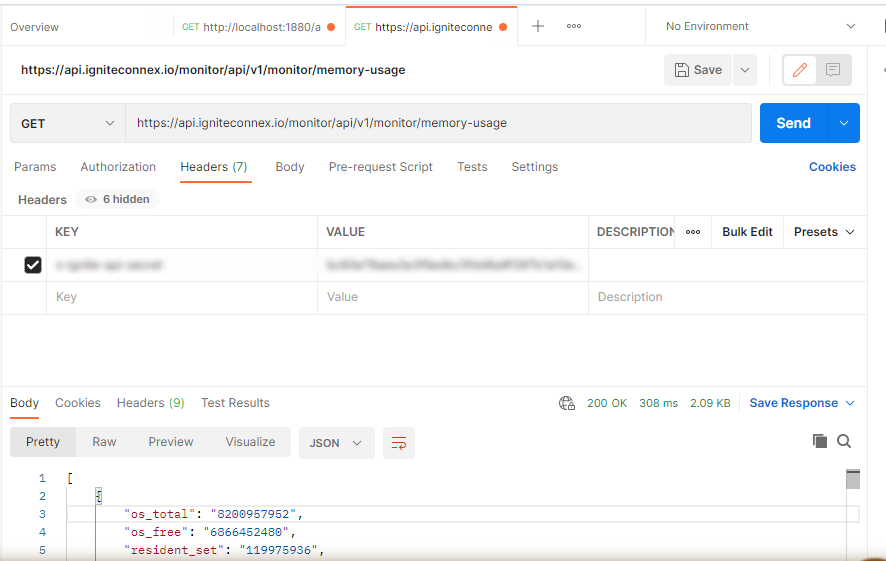
6. Postman Headers
- To use Postman headers, first, create a query in Postman and open the Headers tab. Here you can add key-value pairs to be sent as part of the query. Make sure the keys are formatted correctly and the values are valid before sending the query. You can also use Postman variables or environment variables for the keys and values.
x-ignite-api-secret:- This is an API token, an alphanumeric code that is unique to your ignite account and can be used from any system to validate your API calls.
7. Ignite Monitor is automatically activated for the Cloud.
Let's Experiment using Ignite Connex Monitoring
Add attributes such as exceptions, notifications, and the use of CPU for better monitoring. Also consider adding attributes that identify the type of request, the type of device or browser, and the location of the user:-
We have the following attributes to improve Monitoring.
- http-in
- http-out
- exceptions
- notifications
- cpu-usage
- memory-usage
- heartbeats
Description about each attributes:-
1. Http-in
- HTTP-in is an application-level protocol used to transfer data between a client and a server. It is the foundation of the World Wide Web as it allows clients to send requests to servers and servers to respond with corresponding data. HTTP-in allows clients to specify and receive web resources such as HTML documents, images, videos, and other media.
- To enable HTTP-in, you must configure your system to allow incoming HTTP requests. To do this, you can set up a server to accept incoming requests, configure firewalls to allow requests, and set up an authentication system to ensure that requests come from a trusted source.
2. Http-out
- HTTP-out is an application-level protocol used to transfer data from a server to a client. It is the backbone of the World Wide Web and allows servers to send responses to requests from clients such as HTML documents, images, videos, and other media. HTTP-out allows servers to specify and deliver web resources to clients.
3. Exceptions
- Exceptions inform the user of any exceptions that occurred during the process.
4. Notifications
- Notifications mention any errors that have occurred in the system and contain detailed information about the errors.
5. CPU-Usage
- The CPU usage in Ignite is the amount of processor time required to run an application or process. Ignite uses the CPU to measure the amount of work done by a system and the number of resources used by the system to perform a task. CPU can be managed by limiting the amount of time a process is allowed to run and by using system tools to monitor and manage the number of CPU resources used.
6. Memory-Usage
- Memory usage in Ignite is the amount of memory used by a system to load data and run programs. Ignite uses memory usage to measure the number of resources the system uses to perform a task. Memory usage can be managed by limiting the amount of memory a process can use or by using system tools to monitor and manage the amount of memory resources used.
7. Heartbeats
- Heartbeats inform the user about the system's health being down, along with the amount of time it was down for. It also informs the user when the system is ready to operate.
The IgniteConnex Health Monitor Graph
- The IgniteConnex Health Monitor Graph allows users to quickly identify health trends, set goals and make informed decisions about the health of their system. It also provides an easy-to-read summary of key health metrics that can be used to assess the overall health of the system. In addition, the IgniteConnex Health Monitor Graph provides an alert system that notifies users when the health of their system is at risk, so they can act quickly and make the necessary changes to improve the health of the system.
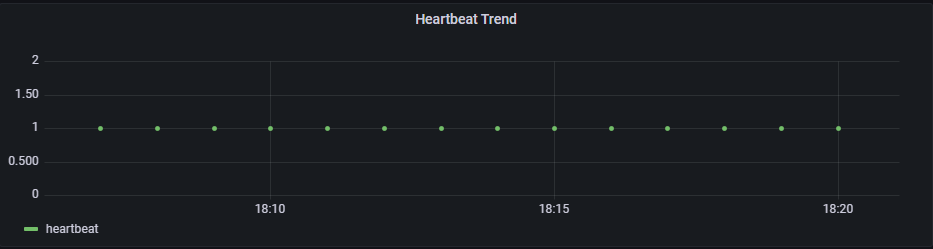
- So, we can conclude that IgniteConnex Health Monitor Graph illustrates the current health status of a system in a visually appealing way.